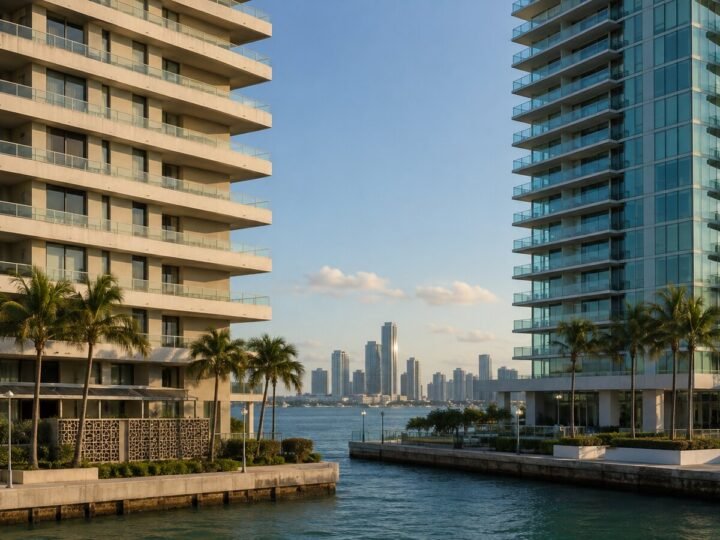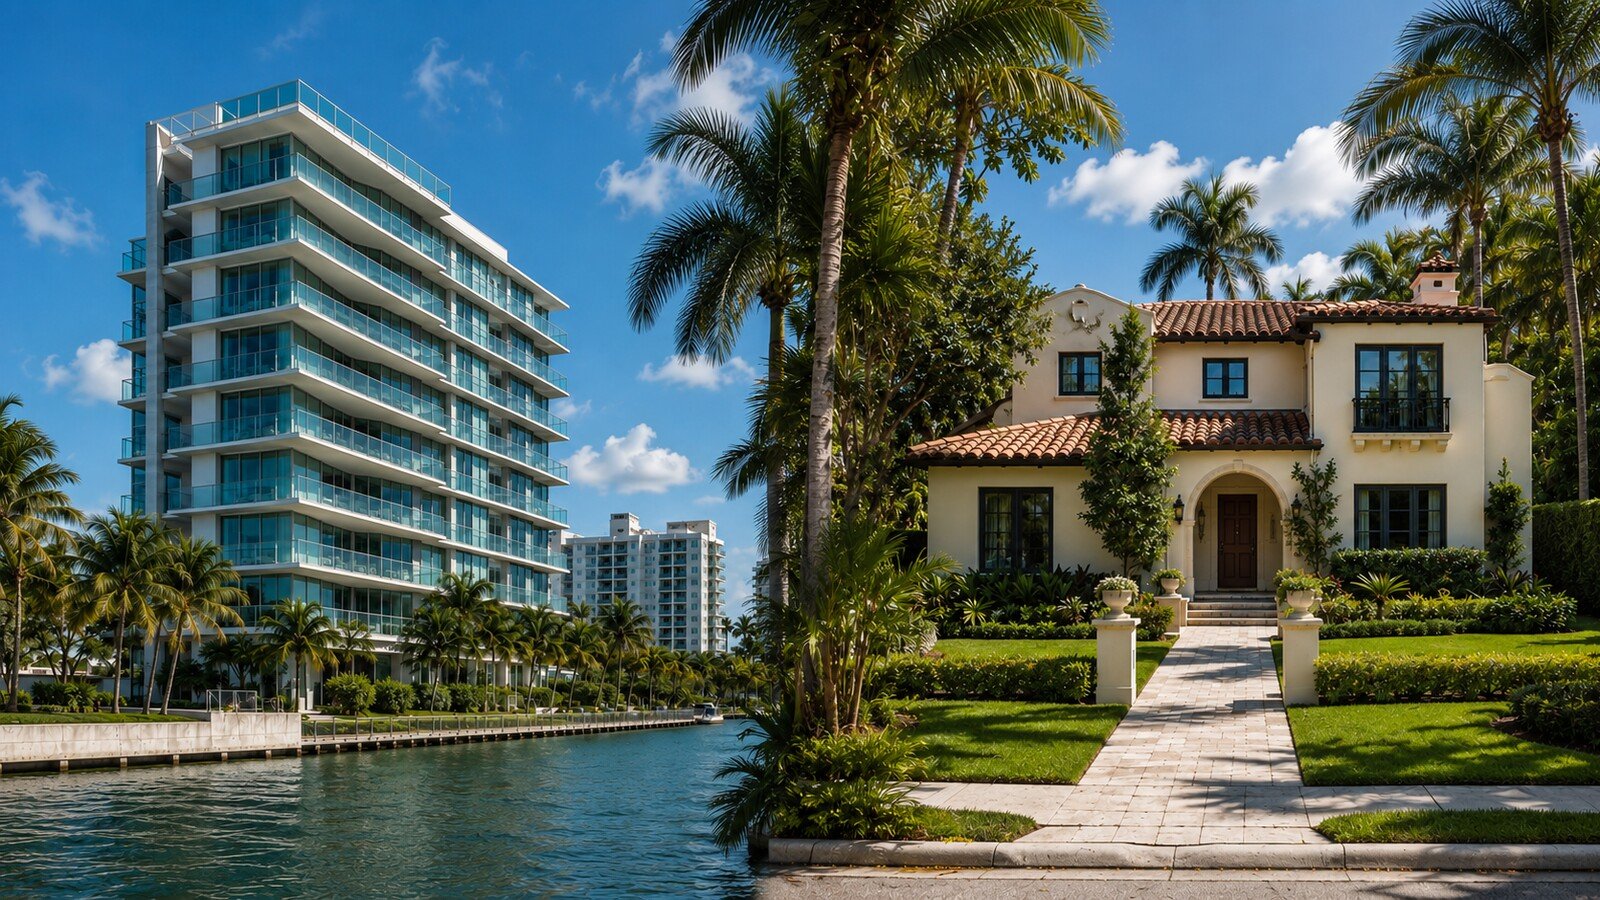
Miami condos and houses are diverging in 2026. In June, the median sale price for a Miami-Dade single-family home increased 3.73 percent from a year earlier to $695,000, while the existing-condo median declined 3.15 percent to $431,000. That created the 6.88 percentage-point split highlighted in Miami Finance Review’s Instagram analysis. The latest July data confirm the same direction: single-family prices rose 3.79 percent to $685,000, condo prices fell 1.48 percent to $400,000, and the performance gap remained 5.27 percentage points.
The split is not evidence that Miami has one strong housing market and one broken market. In both June and July, sales increased in each segment, inventory declined in each, and distressed transactions remained rare. The more useful explanation is structural. Detached homes have scarce supply, while condominium buyers are pricing association reserves, building insurance, inspections, deferred maintenance and potential assessments into the value of each unit. Miami is increasingly behaving like two markets with different scarcity, liquidity and carrying-cost profiles.
Updated August 26, 2026: This article preserves the June comparison used in MFR’s “Condos and Houses Diverge” Instagram post and adds July’s newly released data as a confirmation check. The June 6.9-point figure remains the social-post benchmark; July shows that the divide persisted, though it narrowed.
Key takeaways
- June produced the 6.88 percentage-point divergence featured on Instagram. Single-family median prices rose 3.73 percent year over year, while condo medians fell 3.15 percent.
- July confirmed the split at 5.27 percentage points. Single-family prices were still rising as existing-condo prices remained below their year-earlier level.
- Condo supply stayed about 2.5 times the single-family level. July ended with 12.0 months of condo inventory versus 4.8 months for detached homes.
- Liquidity remained slower for condos. In July, condos took a median 86 days to contract and 125 days to sell, compared with 45 and 88 days for single-family homes.
- Building-level costs matter. Reserves, insurance, inspections, deferred maintenance and assessments can reduce what buyers will pay for an individual condo unit.
- This is repricing, not broad distress. July sales rose 5.6 percent for single-family homes and 11.4 percent for condos, while distressed transactions represented only 0.2 percent of residential closings.
Data note: This analysis uses Miami-Dade existing-home statistics released through August 17, 2026. The June comparison aligns with MFR’s Instagram post, and July is presented as the latest confirmation. The data exclude most new construction, preconstruction and condo-conversion sales. Monthly medians can change with the mix of properties sold. First-half figures below are simple averages of monthly medians, not repeat-sales indexes or seasonally adjusted measures.
Miami condo prices vs. single-family homes at a glance
| Indicator | Single-family | Existing condo | What the gap shows |
|---|---|---|---|
| Median sale price | $695,000 | $431,000 | $264,000 difference |
| Year-over-year price change | +3.73% | -3.15% | 6.88 percentage points |
| Closed sales | 1,049, up 16.82% | 1,058, up 11.96% | Demand improved in both |
| Active listings | 4,380, down 22.74% | 11,550, down 11.47% | Condo choices remained much deeper |
| Months of supply | 4.9 months | 12.3 months | Seller’s market versus buyer’s market |
| Median days to contract | 52 days | 85 days | Condos required 33 more days |
| Median days to sale | 94 days | 124 days | Condos required 30 more days |
| Original list price received | 95% | 94% | A modest but meaningful negotiation gap |
| Cash share | 27.6% | 48.5% | Different buyer composition |
Source: MIAMI REALTORS + RWorld, June 2026 Miami-Dade statistics. Calculations and comparisons labeled as MFR analysis.
July confirms the condo-house divergence
July provides an important check on the June snapshot. The gap narrowed, but it did not reverse. Miami-Dade’s single-family median rose 3.79 percent year over year to $685,000, while the existing-condo median declined 1.48 percent to $400,000. That left a 5.27 percentage-point difference in annual price performance, according to the latest MIAMI REALTORS + RWorld report.
| Indicator | June 2026 | July 2026 | Latest signal |
|---|---|---|---|
| Single-family median | $695,000 | $685,000 | Still above the prior year |
| Single-family annual change | +3.73% | +3.79% | Price growth held |
| Existing-condo median | $431,000 | $400,000 | Still below the prior year |
| Condo annual change | -3.15% | -1.48% | Decline moderated |
| Price-performance gap | 6.88 points | 5.27 points | Divergence persisted |
| Single-family supply | 4.9 months | 4.8 months | Inventory remained constrained |
| Condo supply | 12.3 months | 12.0 months | Buyer choice remained deep |
| Distressed share | 0.5% | 0.2% | No broad distress signal |
Inventory and marketing time reinforce the price story. July had 4,275 active single-family listings and 11,324 active condo listings. Condos required a median 86 days to contract and 125 days to sell, nearly unchanged from June, while single-family homes moved more quickly at 45 and 88 days. Both property types posted higher sales, and distressed closings fell to just 0.2 percent of the market.
The first half established the split
One month does not establish a trend, especially when the median can move because a larger share of expensive or inexpensive properties closed. The first six months provide a better check. Miami-Dade single-family medians exceeded their corresponding 2025 levels in five of the first six months. Condo medians were lower in three months, higher in three, and much more volatile.
| Month | Single-family median | Single-family change | Condo median | Condo change |
|---|---|---|---|---|
| January | $699,990 | +3.7% | $420,000 | +1.2% |
| February | $685,000 | +4.6% | $410,000 | -9.9% |
| March | $674,000 | +0.6% | $445,000 | +1.7% |
| April | $670,000 | -1.5% | $450,000 | +1.1% |
| May | $680,000 | +0.7% | $415,000 | -2.4% |
| June | $695,000 | +3.7% | $431,000 | -3.1% |
| Six-month simple average | $683,998 | +2.0% | $428,500 | -2.0% |
The MFR calculation compares the simple average of January through June 2026 monthly medians with the simple average of the corresponding monthly medians reported for 2025. The result is a 3.92 percentage-point first-half divergence: approximately 2.0 percent growth for single-family homes and a 2.0 percent decline for condos. This does not measure the appreciation of an individual property. It does show that June’s split is consistent with the broader 2026 transaction record.
Readers looking for the geographic layer should compare these property-type results with MFR’s Florida home prices by county analysis and its Miami neighborhood price map. County and neighborhood medians can conceal the same property-type divide visible here.
Inventory explains much of the divergence
Price performance usually follows the balance between available supply and qualified demand. In June, Miami-Dade’s 12.3 months of existing-condo supply was 2.51 times the 4.9 months available in the single-family segment. MIAMI REALTORS classifies six to nine months as balanced. On that basis, detached homes were in seller’s-market territory while condos remained in buyer’s-market territory.
The difference is visible in active listings. Miami-Dade had 11,550 existing condos listed at the end of June, compared with 4,380 single-family homes. Condo listings outnumbered detached-home listings by 2.64 to one. Both totals fell from a year earlier, but single-family inventory contracted twice as fast: 22.74 percent versus 11.47 percent.
This matters because Miami cannot quickly create more centrally located detached-home land. The existing single-family stock competes with redevelopment, additions and lot aggregation, while many desirable neighborhoods have limited vacant land. Condo supply can also be constrained, but a single building adds many units, and existing towers can produce multiple competing listings with similar floor plans and amenities. That makes price comparison easier and seller differentiation harder.
MFR’s earlier analysis of Miami condo supply and buyer leverage documented the inventory imbalance. The new conclusion is more specific: the inventory gap is large enough to create a property-type premium even while total Miami-Dade sales are improving.
The condo price is absorbing the building’s cost structure
A detached home’s asking price is primarily attached to one parcel and one structure. A condo unit is also a fractional interest in a shared building. Its economic value therefore reflects two balance sheets: the owner’s unit and the association’s common property.
That second balance sheet has become more visible. Florida’s structural integrity reserve study framework requires covered associations to identify major building components, estimate remaining useful lives and replacement costs, and establish a funding schedule. The Florida Department of Business and Professional Regulation describes SIRS as a budget-planning tool that measures both anticipated structural expenses and the reserves available to meet them.
Under section 718.112 of the Florida Statutes, the study must account for funding through regular assessments, special assessments, association credit or other permitted methods. If the funding method changes, the study and funding schedule may need to be updated. For the market, this converts deferred maintenance from an abstract future concern into a more measurable annual or one-time obligation.
The result is not a universal discount for older condos. It is wider dispersion among buildings. A tower with completed inspections, credible reserves, recent capital work and transparent records can separate itself from a similar-looking property with uncertain repairs or an unresolved funding plan. MFR’s guides to milestone inspections and SIRS and Florida condo special assessments explain those building-level variables in detail.
Insurance is improving, but cost visibility still matters
Florida’s insurance market provides an important counterweight to the cost-pressure narrative. The Florida Office of Insurance Regulation’s July 2026 stability report said 44 companies had requested residential rate decreases and 48 had requested no change for policies effective in 2024 or later. Preliminary 2026 data also indicated lower risk-adjusted reinsurance costs across most layers.
That improvement can reduce future pressure, but it does not make every building’s insurance position identical. Coverage terms, replacement values, deductibles, loss history, wind mitigation and building condition remain property-specific. In a condominium, the master policy is part of the association’s operating cost, so even a stabilizing insurance market can leave meaningful differences between buildings.
The correct 2026 interpretation is therefore nuanced. Condo prices are not simply responding to ever-rising insurance. They are responding to a more transparent total cost of ownership at a time when buyers have enough inventory to compare buildings closely. MFR’s report on Florida’s improving insurance market shows why the insurance component may become less restrictive if recent trends continue.
Liquidity and buyer composition reinforce the gap
June’s marketing times show the practical effect of excess supply. A Miami-Dade condo took a median 85 days to secure a contract, compared with 52 days for a single-family home. The median time to sale was 124 days for condos and 94 days for detached homes. Longer exposure gives buyers more opportunities to compare listings and gives sellers more reason to adjust pricing or terms.
Cash participation also differed sharply. Cash represented 48.5 percent of existing-condo sales but 27.6 percent of single-family transactions. That does not prove condos are weaker. Miami’s international and second-home demand has long produced a high cash share. It does show that the two segments are clearing through different pools of buyers, which can cause their medians to respond differently to economic conditions.
Most importantly, liquidity improved without erasing the price split. Condo sales increased 11.96 percent from a year earlier, and single-family sales rose 16.82 percent. A market can transact more units while prices remain soft if supply is deep and sellers are meeting the market. That is closer to Miami’s 2026 condo story than a collapse narrative.
Florida’s statewide data show why Miami is different
The statewide comparison helps isolate the local effect. In June, Florida’s single-family median increased 4.9 percent year over year to $432,000, while the condo-townhouse median rose 1.7 percent to $305,000, according to Florida Realtors. Both statewide property types appreciated, although single-family homes still led by 3.2 percentage points.
Miami-Dade’s 6.88-point spread was more than twice as wide, and its condo median moved in the opposite direction from the statewide measure. That supports a localized explanation centered on Miami’s unusually large and varied condo inventory, its concentration of older coastal buildings, and its mix of international, luxury and cash activity.
The distinction also prevents an analytical error. Florida condo-townhouse data combine many lower-rise townhomes and inland properties that do not share the same reserve, inspection or coastal-risk profile as a Miami-Dade tower. The statewide number is useful context, but it cannot substitute for property-type and building-level analysis.
This is a repricing cycle, not a distress cycle
Several indicators argue against treating the divergence as a broad housing failure. Total Miami-Dade sales reached 2,107 in June, the strongest June since 2023. Total residential inventory declined 14.9 percent from a year earlier. Distressed sales represented only 0.5 percent of closings, far below the 70 percent share reported during 2009.
The 2026 adjustment is better understood as price discovery. Sellers and buyers are assigning explicit values to scarcity, building condition, reserves and future obligations. Single-family homes are receiving a scarcity premium. Condos are being sorted more aggressively by building quality and cost visibility.
That process can be constructive. Better disclosure gives well-managed buildings a way to demonstrate quality. Lower prices in buildings with unresolved costs can create room for those costs to be recognized rather than hidden. Stronger sales volume can help the market clear inventory. The central risk is not that every condo falls together, but that citywide medians continue to obscure a widening difference between individual buildings.
The MFR four-factor framework for reading the split
| Factor | Stronger signal | Caution signal |
|---|---|---|
| Supply | Few comparable listings and declining months of supply | Many similar units competing in the same building or price band |
| Building capital | Current inspections, aligned reserves and completed major work | Unfunded repairs, uncertain assessments or incomplete records |
| Carrying cost | Stable, documented recurring expenses with clear coverage | Large unexplained increases or material costs outside the regular budget |
| Liquidity | Shorter marketing time and pricing near recent comparable sales | Long exposure, repeated price changes and a narrow buyer pool |
The framework explains why a county median should be the beginning of analysis, not the conclusion. A well-run condo with limited competing inventory can outperform the condo aggregate. A detached home with property-specific defects can underperform the single-family median. MFR’s Miami housing market forecast uses the same segmentation principle when evaluating longer-term scenarios.
What could narrow or widen the price divergence
The gap could narrow if condo months of supply continues to fall, association funding plans become easier to compare, insurance improvements reach more buildings and marketing times shorten. June already contained part of that constructive case: condo inventory declined for a fifth consecutive month, and sales increased by nearly 12 percent.
The gap could widen if detached-home inventory contracts further, condo marketing times remain elevated, or additional building costs are recognized faster than sellers adjust expectations. A change in the mix of transactions could also move either median without a comparable change in underlying property values.
July’s release confirms the direction established in June. MFR will watch the same four measures when August data arrive: months of supply by property type, days to contract, the share of original list price received and the direction of condo inventory. Readers can also follow MFR’s July 2026 Florida housing market analysis for the statewide comparison.
Frequently asked questions
Are Miami condo prices falling in 2026?
Miami-Dade’s existing-condo median has been uneven rather than uniformly lower. It fell 3.15 percent year over year in June and 1.48 percent in July, to $400,000. Individual buildings and price tiers can perform very differently, so buyers should evaluate building-level finances and comparable sales.
Why are Miami single-family prices outperforming condos?
The clearest difference is supply. Miami-Dade had 4.8 months of single-family inventory in July versus 12.0 months for condos. Detached homes also face a land constraint, while condo values reflect both unit demand and building-level reserves, insurance, inspections and capital needs.
Is the Miami condo market crashing?
The latest data do not indicate a broad crash. July condo sales increased 11.4 percent year over year, condo inventory declined 11.79 percent and distressed transactions represented only 0.2 percent of Miami-Dade residential closings. The evidence points to uneven repricing across buildings.
Is a condo or single-family home the better value in Miami?
There is no universal answer. Condos generally offer a lower median entry price and more inventory, while single-family homes currently have greater scarcity. The meaningful comparison includes location, condition, recurring costs, association finances, available supply and the expected ownership period.
Do HOA fees and special assessments affect Miami condo prices?
They can. Buyers may capitalize recurring association expenses and known assessments into the amount they are willing to pay. The effect depends on whether the spending addresses completed improvements, future repairs, reserve shortfalls or ordinary operations.
How often should the Miami price divergence be updated?
Monthly data provide an early signal, but a quarterly review is more reliable because medians are sensitive to the mix of properties sold. This article was updated on August 26, 2026, with July data, while preserving June’s 6.9-point comparison for alignment with MFR’s Instagram analysis.
Sources and methodology
Miami Finance Review analyzed monthly existing-home statistics available through August 17, 2026. The June data form the social-post comparison, and July is used as a confirmation check. MFR calculated percentage changes from the source medians when necessary, property-type spreads, supply ratios, marketing-time differences and simple first-half averages. Figures may vary with later MLS revisions. This article is general market analysis and is not individualized legal, tax, investment, insurance, real estate or lending advice.
- MIAMI REALTORS + RWorld, January 2026 Miami-Dade statistics
- MIAMI REALTORS + RWorld, February 2026 Miami-Dade statistics
- MIAMI REALTORS + RWorld, March 2026 Miami-Dade statistics
- MIAMI REALTORS + RWorld, April 2026 Miami-Dade statistics
- MIAMI REALTORS + RWorld, May 2026 Miami-Dade statistics
- MIAMI REALTORS + RWorld, June 2026 Miami-Dade statistics
- MIAMI REALTORS + RWorld, July 2026 Miami-Dade statistics
- Florida Realtors, June and second-quarter 2026 housing report
- Florida Realtors, July 2026 housing report
- Florida DBPR, SIRS reporting and database
- Florida Statutes, section 718.112
- Florida Office of Insurance Regulation, July 2026 Property Insurance Stability Report
Market intelligence. Capital insight. Delivered daily.
Miami Finance Review produces independent editorial analysis. Figures are attributed to their sources and independently cross-checked where possible. This content is informational and is not investment, legal, tax or lending advice.