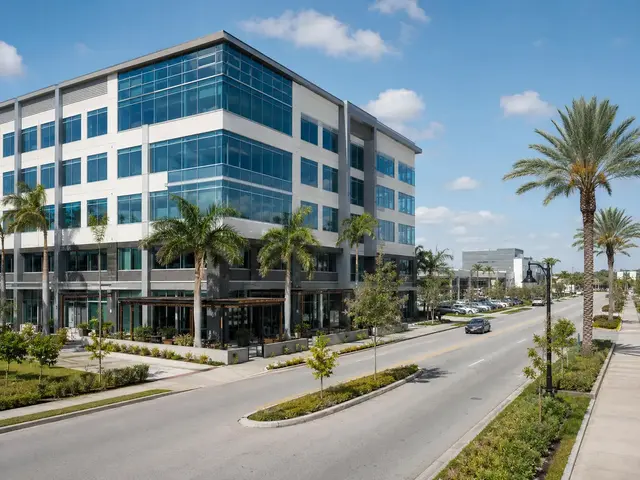
Brickell office space carried an average Class A asking rent of $109.97 per square foot in the second quarter of 2026, according to Cushman & Wakefield. That was about 51% above the $72.77 Miami Class A average reported in the same dataset. Brickell also posted 105,399 square feet of positive net absorption during the quarter.
Those figures support the case for a flight to trophy-quality offices, but they do not mean every Brickell building is full or that every premium is justified. Cushman & Wakefield measured Brickell’s overall vacancy at 13.1% in Q2, while a MIAMI REALTORS analysis based on Yardi Matrix reported only 3.7% vacancy in February. The gap is not a rounding error. It is a reminder that measurement date, building universe, property classification and treatment of available space can materially change the result.
Key takeaways
- Brickell’s Q2 2026 full-service asking rent averaged $90.91 per square foot across all classes and $109.97 for Class A space.
- Cushman & Wakefield reported 13.1% overall Brickell vacancy, while MIAMI REALTORS reported 3.7% for February using a different dataset and measurement period.
- Brickell generated 105,399 square feet of positive net absorption in Q2 and 116,019 square feet through the first half of 2026.
- A 10,000-square-foot Class A requirement priced at the Brickell average carries about $372,000 more annual asking rent than the Miami Class A average, before concessions and other adjustments.
- The market is not simply Brickell versus the suburbs. Performance increasingly separates building by building according to age, efficiency, systems, amenities, transit access and contiguous availability.
Data note: Asking rent is not the same as effective rent, and vacancy is not always the same as availability. This article identifies the source and period for each market figure and does not combine incompatible datasets into a single average.
The Q2 2026 Brickell office snapshot
The Cushman & Wakefield Q2 2026 Miami Office MarketBeat placed Brickell Avenue’s tracked office inventory at 6,907,638 square feet. It reported 887,337 square feet of direct vacant space, 14,543 square feet of vacant sublease space and a 13.1% overall vacancy rate.
| Brickell metric | Q2 2026 reading | What it measures |
|---|---|---|
| Tracked inventory | 6,907,638 square feet | Office inventory included in the provider’s Brickell Avenue submarket |
| Overall vacancy | 13.1% | Direct and sublease vacancy within the tracked inventory |
| Q2 net absorption | 105,399 square feet | Occupied-space change during the quarter |
| First-half net absorption | 116,019 square feet | Occupied-space change through June 2026 |
| First-half leasing activity | 126,270 square feet | Reported leasing activity, excluding renewals under the report’s methodology |
| All-class asking rent | $90.91 per square foot | Average full-service asking rent |
| Class A asking rent | $109.97 per square foot | Average full-service asking rent for Class A inventory |
Brickell’s positive absorption was part of a stronger Miami quarter. Cushman & Wakefield reported 245,511 square feet of Q2 net absorption across Miami and 327,774 square feet for the first half. Its report described the first-half performance as the strongest since 2023.
CBRE’s Q2 2026 Miami figures also showed an improving market, but its totals were different: 344,000 square feet of quarterly net absorption, 14.9% vacancy and a $68.60 average asking rent. CBRE also counted 1.3 million square feet under construction, compared with 394,556 square feet in Cushman & Wakefield’s table. These differences reinforce the need to stay within one provider’s dataset when calculating spreads or comparing submarkets.
Brickell’s rent premium is substantial
Within the Cushman & Wakefield dataset, Brickell’s $109.97 Class A asking rent exceeded the Miami Class A average of $72.77 by $37.20 per square foot. The percentage premium was approximately 51.1%:
($109.97 minus $72.77) divided by $72.77 = 51.1% Brickell Class A asking-rent premium.
The premium is larger than a prestige surcharge in an abstract sense. It translates into a material occupancy-cost difference for a corporate requirement.
| Illustrative 10,000-square-foot requirement | Annual asking-rent calculation | Amount |
|---|---|---|
| Brickell Class A average | 10,000 x $109.97 | $1,099,700 |
| Miami Class A average | 10,000 x $72.77 | $727,700 |
| Annual Brickell premium | $1,099,700 minus $727,700 | $372,000 |
| Seven-year simple gross premium | $372,000 x 7 | $2,604,000 |
Calculation limits: This is a reproducible asking-rent comparison, not a lease proposal or effective-rent analysis. It excludes contractual escalations, free rent, tenant-improvement allowances, operating-expense reconciliations, parking, taxes, moving costs, financing and the time value of money. It also assumes the same rentable area in both cases.
A tenant may still conclude that the premium is rational if a Brickell location improves recruiting, client access, space utilization or proximity to related firms. Another tenant may place greater value on cost, parking or a newer alternative outside the submarket. The correct comparison is total occupancy cost relative to the operating benefit, not asking rent alone.
Why Brickell vacancy reports disagree
In March 2026, MIAMI REALTORS reported that Brickell had a 3.7% vacancy rate in February, the lowest among the South Florida submarkets covered in its analysis. It also reported that 96% of Brickell inventory was Class A or A+ and that 830 Brickell was 95% occupied.
Three months later, Cushman & Wakefield reported 13.1% vacancy for Brickell Avenue. Readers should not interpret the ten-point gap as proof that vacancy suddenly tripled. Several methodological factors may explain much of the difference:
- Measurement date: one reading covers February, while the other covers the second quarter ending in June.
- Inventory universe: providers may include different buildings, mixed-use office components, ownership structures or minimum property sizes.
- Class filters: an analysis focused on prime or Class A inventory can show much tighter conditions than an all-class submarket total.
- Direct, sublease and future space: vacancy and availability can differ depending on whether occupied sublease listings or announced future move-outs are counted.
- Data revisions: leases, occupancy dates and building deliveries can be recorded at different times.
The practical conclusion is not that one source must be wrong. It is that a decision-maker should obtain the building list and definitions behind the number. For a tenant seeking 25,000 contiguous square feet, the availability of suitable blocks matters more than the submarket percentage. For an owner or investor, current rent roll, lease expirations and building-specific downtime are more useful than a general vacancy headline.
The flight to trophy is really a flight to specific attributes
There is no universal statutory definition of a trophy office building. In market practice, the label usually refers to a rare combination of location, recent construction or major renovation, institutional systems, efficient floorplates, strong views, amenities, modern security and the ability to accommodate demanding tenants.
Brickell’s concentration of financial, legal and professional-services firms reinforces the value of those attributes. MFR’s analysis of companies moving to Miami explains how headquarters and regional-office decisions support demand for client-ready space. The broader Miami commercial real estate outlook shows why that premium demand can coexist with softer performance in older or less differentiated buildings.
The distinction matters because “flight to quality” can become lazy shorthand. A recently delivered tower is not automatically the best economic choice, and an older building is not automatically obsolete. Older properties can compete through efficient layouts, lower occupancy costs, responsive ownership and targeted capital work. MFR’s review of office repositioning strategies examines the upgrades that can change a building’s competitive set.
What 830 Brickell demonstrates
One building does not define an entire submarket, but 830 Brickell illustrates how premium demand can convert into occupancy. Cushman & Wakefield attributed part of Miami’s Q2 absorption to Kirkland & Ellis taking occupancy of more than 90,000 square feet in the tower. Citadel’s official location page identifies 830 Brickell Plaza as its global headquarters.
That tenant profile strengthens Brickell’s signaling value for other finance and professional-services firms. It also creates concentration and rollover questions for owners and lenders. A prestigious rent roll can support income stability, but underwriting still depends on lease duration, tenant credit, expansion rights, expense structure and the cost of replacing space at expiration.
For tenants, 830 Brickell is evidence that the most desired floors can clear at economics far above the submarket average. It is not evidence that every Brickell building should command the same rate.
Brickell versus other Miami office submarkets
The following table keeps every comparison inside Cushman & Wakefield’s Q2 2026 dataset. That avoids mixing different definitions and dates.
| Submarket | Overall vacancy | All-class asking rent | Class A asking rent |
|---|---|---|---|
| Brickell Avenue | 13.1% | $90.91 | $109.97 |
| Downtown Miami | 19.3% | $68.32 | $73.92 |
| Biscayne / Wynwood / Design | 20.9% | $84.07 | $87.19 |
| Coconut Grove | 8.2% | $64.62 | $80.79 |
| Coral Gables | 16.7% | $63.64 | $66.88 |
| Miami Beach | 21.1% | $89.63 | $93.45 |
| Miami total | 14.6% | $66.40 | $72.77 |
Source: Cushman & Wakefield Q2 2026 Miami Office MarketBeat. Asking rents are full-service averages. Submarket inventory composition differs, so the figures should not be treated as identical building-quality comparisons.
Brickell had the highest Class A asking rent in this group, but not the lowest vacancy. Coconut Grove’s reported 8.2% vacancy was lower. Miami Beach’s all-class rent was close to Brickell’s, yet its Class A rent was roughly $16.52 lower and its vacancy was materially higher. These relationships show that rent reflects building mix and landlord expectations as well as current occupancy.
The supply pipeline is another measurement problem
Cushman & Wakefield counted 394,556 square feet under construction across Miami in Q2 2026, the lowest pipeline in nearly a decade according to its report. CBRE counted 1.3 million square feet. The difference likely reflects project definitions, geography and treatment of owner-occupied or proposed components.
Cushman & Wakefield identified the 85,000-square-foot Safra Bank Building and the 166,800-square-foot project at 2600 Biscayne Boulevard among expected deliveries before year-end. It also described Citadel’s anticipated groundbreaking and other proposed trophy developments as future projects that could replenish the pipeline.
Those categories should remain separate:
- Delivered space competes for occupancy now.
- Under-construction space has started but still carries delivery and leasing risk.
- Planned or anticipated projects may change in timing, scale or configuration.
New supply can pressure undifferentiated buildings while reinforcing the premium tier. Owners facing that competition must compare the cost of capital improvements with the rent and retention benefit. Investors should combine the physical plan with current debt-market conditions, a subject covered in MFR’s analysis of the commercial real estate lending rebound and Miami cap rates.
A practical decision framework
For office tenants
- Convert asking rent into net effective rent using the actual term, escalations, free rent and tenant-improvement package.
- Compare rentable and usable area, including the building’s load factor.
- Price parking, after-hours systems, taxes and controllable operating expenses.
- Measure commute access, client convenience and employee utilization instead of treating amenities as inherently valuable.
- Test expansion, contraction, assignment and renewal options under more than one staffing scenario.
For owners and investors
- Track direct vacancy, sublease availability and scheduled move-outs separately.
- Map lease expirations and tenant concentration by year.
- Compare renovation cost with achievable effective rent, not asking rent alone.
- Stress-test downtime, concessions, improvement allowances, interest expense and refinancing proceeds.
- Evaluate each asset against the buildings tenants actually tour, not the entire Miami inventory.
Outlook: a strong address with wider building-level dispersion
The constructive case for Brickell is supported by positive absorption, high Class A asking rents and continued demand from finance, legal and professional-services firms. The risk is that the submarket’s reputation can obscure differences among buildings and encourage users to treat asking prices as completed economics.
If scheduled occupancies continue and premium blocks remain scarce, trophy rents may retain support. If new deliveries add meaningful contiguous space, corporate expansion slows or sublease availability rises, tenants could gain leverage even while published asking rents remain elevated. Both outcomes can occur within the same year because effective rent and asking rent do not move in lockstep.
The most defensible 2026 conclusion is therefore narrower than “Brickell is full” or “Brickell is oversupplied.” Brickell is a highly segmented office market where premium demand is real, the average rent is expensive and the interpretation of vacancy depends on what is being measured.
Frequently asked questions
What is the average Brickell office rent in 2026?
Cushman & Wakefield reported a Q2 2026 average full-service asking rent of $90.91 per square foot across Brickell office classes and $109.97 for Class A space. Individual buildings, floors and deal terms can vary materially.
What is the Brickell office vacancy rate?
Cushman & Wakefield reported 13.1% overall vacancy in Q2 2026. MIAMI REALTORS reported 3.7% for February using a different dataset. The figures should not be combined because dates, inventory and definitions can differ.
Why is Brickell office space more expensive than the Miami average?
Brickell has a high concentration of Class A inventory, finance and professional-services tenants, transit access, modern buildings and limited premium blocks. Those attributes support higher asking rents, but they do not guarantee that every building or lease delivers equal value.
Is vacancy the same as availability?
No. Vacancy generally refers to space that is physically unoccupied. Availability may also include occupied sublease space or future move-outs that can be leased. Providers can define and track these categories differently.
Does the flight to trophy mean older Brickell offices are obsolete?
No. Older buildings can compete on effective cost, efficient layouts, parking, management and targeted upgrades. The relevant question is how each building compares with the alternatives a specific tenant will consider.
How should a tenant compare a Brickell lease with another Miami submarket?
Compare net effective rent, usable area, parking, improvement costs, operating expenses, commute access, flexibility and the operational value of the location. Asking rent per rentable square foot is only the starting point.
Methodology and sources
Miami Finance Review reviewed Q2 2026 office reports from Cushman & Wakefield and CBRE, the March 27, 2026 MIAMI REALTORS analysis, Citadel’s official location information and relevant MFR market coverage. Comparisons and calculations use figures from the same source unless otherwise stated. MFR did not reproduce proprietary charts or combine incompatible vacancy series.
- Cushman & Wakefield: Miami MarketBeat reports
- Cushman & Wakefield: Q2 2026 Miami Office MarketBeat PDF
- CBRE: Miami Office Figures, Q2 2026
- MIAMI REALTORS: South Florida Office Market Leads the Nation
- Citadel: official office locations
Informational notice: This article is independent journalism and general market information. It is not individualized leasing, legal, tax, investment, appraisal, engineering or financing advice. Market data may be revised, and transaction terms depend on the building, tenant, timing and contract.
Market intelligence. Capital insight. Delivered daily.
Miami Finance Review produces independent editorial analysis. Figures are attributed to their sources and independently cross-checked where possible. This content is informational and is not investment, legal, tax or lending advice.