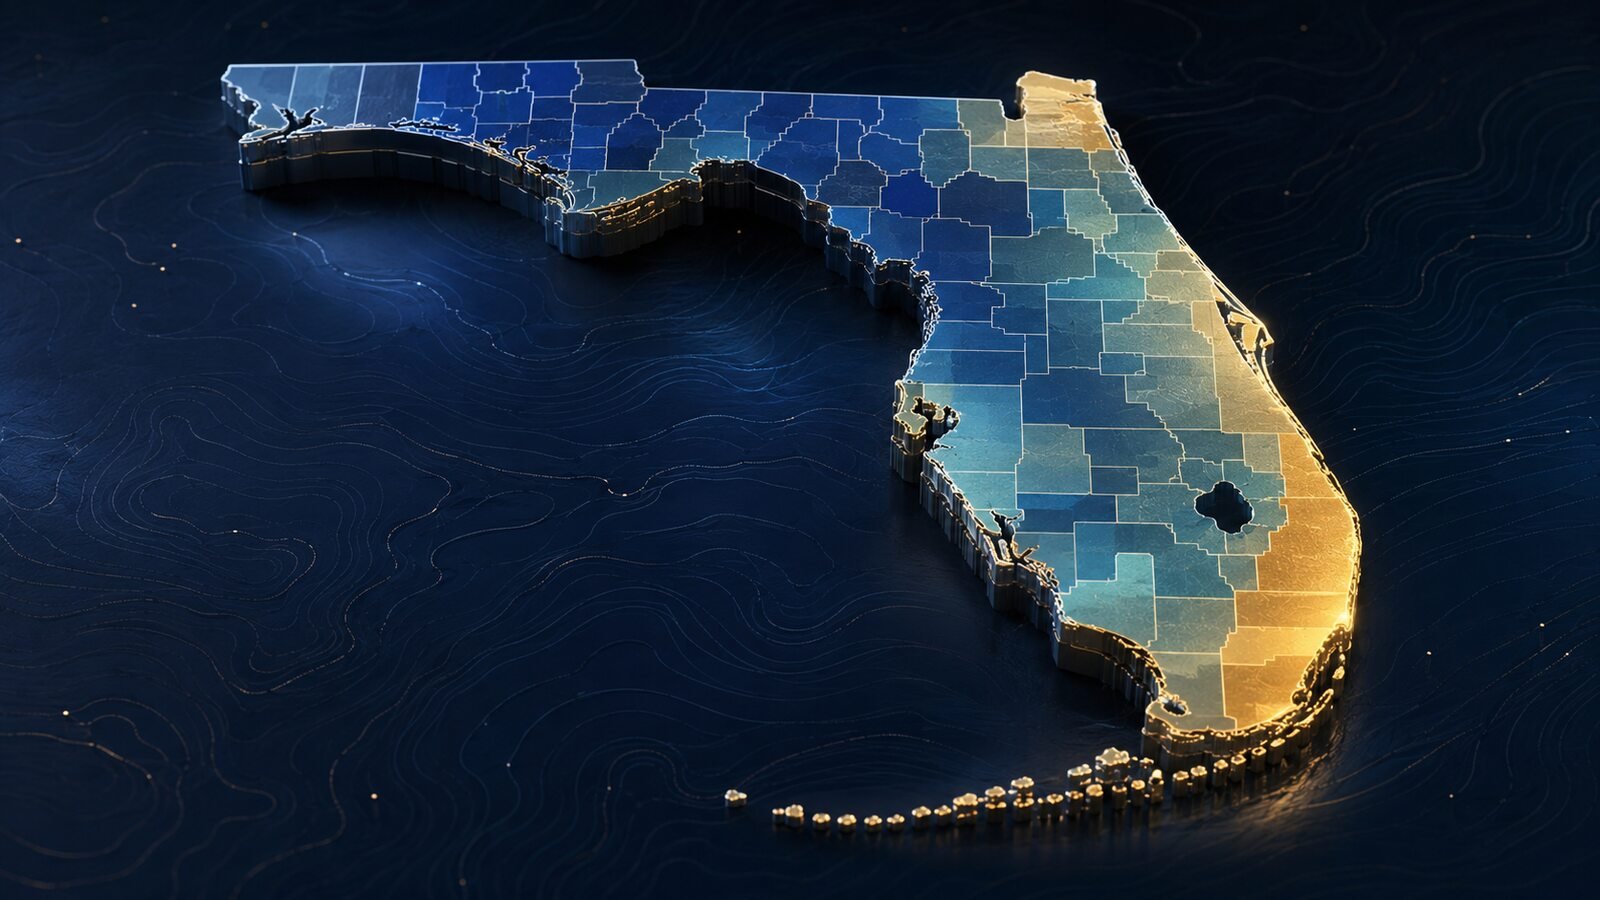
Florida home prices by county range from $179,336 in Calhoun County to $966,261 in Monroe County as of June 2026. The statewide typical home value is $378,126, down 2.8% from a year earlier but still 25.3% above June 2021, according to Miami Finance Review’s analysis of the Zillow Home Value Index. Twenty-two of Florida’s 67 counties posted annual gains. The clearest pattern is not a statewide collapse, but a two-speed market: lower-cost North Florida and inland counties are gaining ground while several Gulf Coast markets continue to work through a larger post-pandemic price adjustment.
Key takeaways
- Florida’s statewide typical home value is $378,126, down 2.8% year over year. It remains 25.3% higher than five years ago.
- Monroe County is Florida’s most expensive county at $966,261, followed by Walton County at $654,437 and Collier County at $555,973.
- Calhoun County is the most affordable at $179,336. Jackson County and Holmes County are also below $190,000.
- Lafayette County recorded the strongest annual gain at 7.5%, while Charlotte County had the largest decline at 8.2%.
- South Florida remains the state’s highest-value large market. Miami-Dade’s typical home value is $522,601, up 39.4% over five years despite a 1.6% annual decline.
- Current sales data are more constructive than the value index alone suggests. Florida single-family sales rose 9.3% and condo-townhouse sales rose 14% in June from a year earlier.
Data date: June 30, 2026. Published: July 29, 2026. Values are Zillow Home Value Index estimates for all homes in the middle price tier, smoothed and seasonally adjusted. Dollar figures are rounded to the nearest dollar and percentage changes are rounded to one decimal place.
Florida home prices by county at a glance
The statewide number conceals a wide spread. A typical home in Monroe County is valued at more than five times the typical home in Calhoun County. The difference reflects far more than geography. Land scarcity, waterfront exposure, local job bases, the mix of second homes, new construction, insurance costs and the amount of available inventory all shape county-level values.
The 2026 rankings also show how Florida’s housing cycle has become increasingly local. Several high-cost coastal counties remain far above their pre-pandemic values even after modest annual declines. At the same time, less expensive counties in North Florida and the Big Bend are still appreciating as buyers search for attainable ownership costs.
How Miami Finance Review measured county home prices
This analysis uses the Zillow Home Value Index, or ZHVI, for all homes in the middle price tier. Zillow defines the index as a measure of the typical home value for homes in roughly the 35th to 65th percentile of a market. It includes single-family homes, condominiums and co-ops and is adjusted to reduce seasonal noise.
ZHVI is not the same as a median sale price. The index estimates the value of the housing stock, including homes that did not sell. A median sale price measures only transactions that closed during a specific period and can rise or fall because the mix of homes sold changed. A median listing price measures what sellers are asking, not what buyers ultimately paid.
That distinction matters in June 2026. Florida’s statewide ZHVI was down 2.8% from a year earlier, while Florida Realtors reported that the median sale price for existing single-family homes rose 4.9% to $432,000. Both statements can be true because they measure different populations. For a broad comparison across all 67 counties, the mix-adjusted ZHVI offers the cleanest consistent series. For a view of current deal flow, closed-sale data remain essential.
Florida home prices by county: all 67 counties ranked
The table below ranks every Florida county by typical home value. The annual column compares June 2026 with June 2025. The five-year column compares June 2026 with June 2021 and shows how much of the pandemic-era repricing remains in place.
| State rank | County | Typical home value | 1-year change | 5-year change |
|---|---|---|---|---|
| 1 | Monroe County | $966,261 | -0.8% | +31.8% |
| 2 | Walton County | $654,437 | -0.7% | +19.8% |
| 3 | Collier County | $555,973 | -4.6% | +30.7% |
| 4 | Miami-Dade County | $522,601 | -1.6% | +39.4% |
| 5 | St. Johns County | $492,885 | -2.7% | +24.1% |
| 6 | Nassau County | $486,173 | -0.9% | +27.6% |
| 7 | Palm Beach County | $473,295 | -1.2% | +32.0% |
| 8 | Martin County | $449,805 | -2.9% | +25.4% |
| 9 | Franklin County | $428,595 | -4.6% | +14.9% |
| 10 | Broward County | $424,261 | -3.6% | +28.5% |
| 11 | Gulf County | $409,562 | -2.9% | +27.6% |
| 12 | Manatee County | $409,246 | -5.4% | +20.0% |
| 13 | Orange County | $404,959 | -2.2% | +27.3% |
| 14 | Seminole County | $404,888 | -2.0% | +25.4% |
| 15 | Sarasota County | $399,487 | -5.5% | +15.2% |
| 16 | Sumter County | $388,599 | -1.3% | +25.4% |
| 17 | Hillsborough County | $380,041 | -2.6% | +25.5% |
| 18 | St. Lucie County | $373,333 | -2.2% | +29.7% |
| 19 | Pinellas County | $371,631 | -3.3% | +18.5% |
| 20 | Indian River County | $365,308 | -2.8% | +24.7% |
| 21 | Lake County | $364,340 | -3.1% | +25.3% |
| 22 | Osceola County | $362,791 | -4.0% | +24.8% |
| 23 | Okaloosa County | $357,488 | +0.1% | +16.4% |
| 24 | Santa Rosa County | $353,844 | +0.6% | +22.4% |
| 25 | Flagler County | $350,829 | -2.6% | +14.6% |
| 26 | Bay County | $346,095 | -1.3% | +22.4% |
| 27 | Brevard County | $344,481 | -1.8% | +21.8% |
| 28 | Clay County | $339,079 | -1.0% | +23.9% |
| 29 | Lee County | $338,437 | -6.4% | +15.7% |
| 30 | Pasco County | $331,852 | -2.8% | +23.0% |
| 31 | Volusia County | $326,543 | -2.2% | +21.7% |
| 32 | Baker County | $321,619 | +3.7% | +25.7% |
| 33 | Hernando County | $310,999 | -2.6% | +30.0% |
| 34 | Gilchrist County | $310,217 | +3.5% | +38.4% |
| 35 | Jefferson County | $308,576 | +3.7% | +34.9% |
| 36 | Alachua County | $307,828 | -1.3% | +21.3% |
| 37 | Charlotte County | $299,141 | -8.2% | +7.2% |
| 38 | Polk County | $298,826 | -3.0% | +23.2% |
| 39 | Leon County | $298,358 | +1.1% | +22.1% |
| 40 | Duval County | $297,493 | -1.7% | +20.5% |
| 41 | Levy County | $291,684 | -2.3% | +30.4% |
| 42 | Okeechobee County | $291,319 | +0.5% | +44.9% |
| 43 | Wakulla County | $289,715 | +0.5% | +27.5% |
| 44 | Escambia County | $283,690 | +1.2% | +23.6% |
| 45 | Suwannee County | $278,996 | +3.7% | +32.5% |
| 46 | Hendry County | $275,334 | -3.5% | +39.2% |
| 47 | Columbia County | $274,669 | +0.1% | +32.4% |
| 48 | Citrus County | $273,929 | -2.2% | +24.4% |
| 49 | Marion County | $273,513 | -2.5% | +29.1% |
| 50 | Union County | $272,385 | +3.4% | +47.3% |
| 51 | Lafayette County | $270,537 | +7.5% | +40.9% |
| 52 | Glades County | $264,792 | -3.6% | +41.8% |
| 53 | Bradford County | $256,701 | +3.5% | +35.3% |
| 54 | DeSoto County | $253,011 | -1.1% | +27.7% |
| 55 | Hardee County | $241,964 | +3.3% | +44.3% |
| 56 | Highlands County | $235,940 | -1.9% | +35.1% |
| 57 | Washington County | $226,021 | -0.6% | +21.4% |
| 58 | Dixie County | $223,102 | +4.2% | +30.8% |
| 59 | Putnam County | $219,440 | +1.1% | +21.1% |
| 60 | Madison County | $215,003 | +0.2% | +31.1% |
| 61 | Liberty County | $207,878 | +4.6% | +33.6% |
| 62 | Hamilton County | $207,718 | +4.1% | +40.7% |
| 63 | Gadsden County | $203,481 | -1.1% | +31.7% |
| 64 | Taylor County | $201,605 | +4.5% | +26.6% |
| 65 | Holmes County | $189,067 | -1.7% | +16.6% |
| 66 | Jackson County | $183,231 | +1.6% | +19.9% |
| 67 | Calhoun County | $179,336 | -1.4% | +13.6% |
Source: Miami Finance Review analysis of Zillow Home Value Index county data. Series: all homes, middle tier, smoothed and seasonally adjusted. Observation date: June 30, 2026. Rankings and percentage changes were calculated by Miami Finance Review.
The 10 most expensive counties in Florida
Florida’s highest-value counties are concentrated in the Keys, South Florida, Southwest Florida and a handful of high-demand coastal or resort markets. The top 10 are Monroe, Walton, Collier, Miami-Dade, St. Johns, Nassau, Palm Beach, Martin, Franklin and Broward.
| Rank | County | Typical value | 1-year change | 5-year change |
|---|---|---|---|---|
| 1 | Monroe County | $966,261 | -0.8% | +31.8% |
| 2 | Walton County | $654,437 | -0.7% | +19.8% |
| 3 | Collier County | $555,973 | -4.6% | +30.7% |
| 4 | Miami-Dade County | $522,601 | -1.6% | +39.4% |
| 5 | St. Johns County | $492,885 | -2.7% | +24.1% |
| 6 | Nassau County | $486,173 | -0.9% | +27.6% |
| 7 | Palm Beach County | $473,295 | -1.2% | +32.0% |
| 8 | Martin County | $449,805 | -2.9% | +25.4% |
| 9 | Franklin County | $428,595 | -4.6% | +14.9% |
| 10 | Broward County | $424,261 | -3.6% | +28.5% |
Monroe County sits in a category of its own. The county includes the Florida Keys, where buildable land is scarce and waterfront or water-adjacent housing represents an unusually large share of the market. Walton County, home to the 30A corridor and luxury communities along the Emerald Coast, ranks second.
Miami-Dade is the most expensive of Florida’s large, diversified counties at $522,601. Its 39.4% five-year gain is also the strongest among the state’s 10 highest-value counties. That durability is consistent with the broader shift documented in Miami Finance Review’s Miami housing market forecast: limited land, international demand and high-income migration can support premium submarkets even when affordability slows the mainstream market.
The 10 most affordable counties in Florida
The lowest typical home values are concentrated in rural North Florida, the Panhandle and the Big Bend. Calhoun, Jackson and Holmes counties are below $190,000, while all 10 of the most affordable counties are below $225,000.
| Affordability rank | County | Typical value | 1-year change | 5-year change |
|---|---|---|---|---|
| 1 | Calhoun County | $179,336 | -1.4% | +13.6% |
| 2 | Jackson County | $183,231 | +1.6% | +19.9% |
| 3 | Holmes County | $189,067 | -1.7% | +16.6% |
| 4 | Taylor County | $201,605 | +4.5% | +26.6% |
| 5 | Gadsden County | $203,481 | -1.1% | +31.7% |
| 6 | Hamilton County | $207,718 | +4.1% | +40.7% |
| 7 | Liberty County | $207,878 | +4.6% | +33.6% |
| 8 | Madison County | $215,003 | +0.2% | +31.1% |
| 9 | Putnam County | $219,440 | +1.1% | +21.1% |
| 10 | Dixie County | $223,102 | +4.2% | +30.8% |
Affordability does not automatically mean better value. Employment depth, commute options, healthcare access, flood exposure, insurance availability, housing condition and resale liquidity vary sharply. Buyers comparing low-price counties should evaluate the total monthly cost and the local economic base, not just the purchase price.
Still, the price gap explains why inland and northern counties are attracting more attention. A household that cannot make the payment math work in South Florida or the Gulf Coast metros may find a meaningfully lower entry point in markets such as Jackson, Taylor, Hamilton or Putnam. Buyers should run the numbers using current Florida mortgage rates, property taxes, insurance and maintenance before deciding what is truly affordable.
Where Florida home values are rising fastest
The strongest annual appreciation is not coming from the best-known coastal markets. Lafayette County leads with a 7.5% gain, followed by Liberty at 4.6%, Taylor at 4.5%, Dixie at 4.2% and Hamilton at 4.1%.
| Growth rank | County | Typical value | 1-year change | 5-year change |
|---|---|---|---|---|
| 1 | Lafayette County | $270,537 | +7.5% | +40.9% |
| 2 | Liberty County | $207,878 | +4.6% | +33.6% |
| 3 | Taylor County | $201,605 | +4.5% | +26.6% |
| 4 | Dixie County | $223,102 | +4.2% | +30.8% |
| 5 | Hamilton County | $207,718 | +4.1% | +40.7% |
| 6 | Baker County | $321,619 | +3.7% | +25.7% |
| 7 | Jefferson County | $308,576 | +3.7% | +34.9% |
| 8 | Suwannee County | $278,996 | +3.7% | +32.5% |
| 9 | Gilchrist County | $310,217 | +3.5% | +38.4% |
| 10 | Bradford County | $256,701 | +3.5% | +35.3% |
Nine of the 10 fastest-appreciating counties have typical values below Florida’s statewide $378,126 level. This suggests that affordability is functioning as a competitive advantage. Some households are widening their search radius, while investors and local buyers are bidding in markets where the absolute monthly payment remains more manageable.
The gains should be interpreted with care. Smaller counties have thinner transaction volumes, so changes in demand or available inventory can have an outsized effect. A one-year leaderboard is a snapshot, not a forecast. The stronger signal is the broader cluster of positive readings across lower-cost North Florida and inland markets.
Where home values have adjusted the most
Charlotte County posted the largest annual decline at 8.2%, followed by Lee at 6.4%, Sarasota at 5.5% and Manatee at 5.4%. The concentration along the Gulf Coast is notable.
| County | Typical value | 1-year change | 5-year change |
|---|---|---|---|
| Charlotte County | $299,141 | -8.2% | +7.2% |
| Lee County | $338,437 | -6.4% | +15.7% |
| Sarasota County | $399,487 | -5.5% | +15.2% |
| Manatee County | $409,246 | -5.4% | +20.0% |
| Collier County | $555,973 | -4.6% | +30.7% |
| Franklin County | $428,595 | -4.6% | +14.9% |
| Osceola County | $362,791 | -4.0% | +24.8% |
| Broward County | $424,261 | -3.6% | +28.5% |
| Glades County | $264,792 | -3.6% | +41.8% |
| Hendry County | $275,334 | -3.5% | +39.2% |
This is better described as repricing than erasure of long-term gains. Collier County is down 4.6% over the past year but remains 30.7% above June 2021. Broward is down 3.6% annually and still up 28.5% over five years. Even Charlotte County, the weakest annual reading, remains 7.2% above its June 2021 level.
Several Gulf Coast markets experienced unusually rapid pandemic-era demand, followed by more inventory, higher ownership costs and a slower return of buyers at current rates. That combination creates more negotiating room. It does not mean every neighborhood, building or property type is declining at the county average. Waterfront homes, new construction, older condos and inland subdivisions can behave very differently inside the same county.
South Florida remains the state’s high-value anchor
South Florida continues to combine high absolute values with substantial five-year appreciation. Miami-Dade’s typical home value is $522,601, Palm Beach is $473,295 and Broward is $424,261. All three are below their June 2025 levels, but they remain 39.4%, 32.0% and 28.5% above June 2021, respectively.
Current activity adds a constructive layer. Zillow’s June 2026 market report estimated that Miami metro home sales rose 17.9% from a year earlier while inventory fell 14%. The metro’s typical value declined 1.2%, which means more transactions occurred even as values eased. That is a sign of market clearing, not paralysis.
The region remains expensive, and ownership costs matter. Prospective buyers should examine Florida homeowners insurance, condominium assessments and local taxes alongside the headline price. For neighborhood-level differences within Miami-Dade, the publication’s guide to the best neighborhoods in Miami provides a more granular starting point.
Central Florida and Tampa Bay are giving buyers more leverage
Central Florida’s major counties are clustered near the statewide value. Orange County stands at $404,959, Seminole at $404,888, Osceola at $362,791 and Polk at $298,826. Annual changes range from a 2.0% decline in Seminole to a 4.0% decline in Osceola, but every one of those counties is at least 23% above June 2021.
Tampa Bay shows a similar reset. Hillsborough’s typical value is $380,041, Pinellas is $371,631 and Pasco is $331,852. Values are down between 2.6% and 3.3% annually. For buyers, that normalization can create a healthier search process, with more opportunity to compare properties and negotiate repairs or concessions than during the bidding wars of 2021 and early 2022.
Zillow estimated June sales were up 14.3% year over year in the Orlando metro and 3.3% in Tampa. That divergence reinforces the central lesson of the county rankings: Florida is no longer moving as one market.
Northeast Florida combines premium suburbs with attainable urban values
Northeast Florida has one of the state’s widest intra-regional price spreads. St. Johns County ranks fifth statewide at $492,885, and Nassau ranks sixth at $486,173. Duval County, centered on Jacksonville, is far lower at $297,493. Baker County is $321,619 and recorded a 3.7% annual increase, one of the state’s 10 strongest gains.
The region’s appeal is straightforward: buyers can choose between premium coastal and master-planned communities, established Jacksonville neighborhoods and lower-cost rural options without leaving the broader Northeast Florida employment market. That variety can help the region absorb demand even when mortgage rates limit purchasing power.
The Panhandle is not one housing market
Walton County’s $654,437 typical value makes it Florida’s second-most expensive county. Nearby resort and coastal markets also carry premiums, including Franklin at $428,595 and Gulf at $409,562. Yet other Panhandle counties sit near the bottom of the statewide table, including Holmes at $189,067, Jackson at $183,231 and Calhoun at $179,336.
The contrast reflects the Panhandle’s mix of luxury beach corridors, military and government employment centers, college markets and rural communities. A regional average would obscure more than it reveals. County and submarket data are necessary before comparing investment returns or household affordability.
What the county rankings mean for buyers in 2026
1. Separate price from total cost
A lower purchase price can be offset by insurance, flood coverage, commuting, renovations or association fees. A higher-priced county may offer stronger employment access or resale liquidity. Build a monthly ownership budget that includes principal, interest, taxes, insurance, association charges and a maintenance reserve.
2. Use annual declines as a negotiation signal, not a market verdict
Counties with falling values may offer more leverage, especially where listings have been sitting or need repairs. The decline does not automatically make every home a bargain. Compare recent sales, active competition and property-specific risks. Miami Finance Review’s analysis of whether 2026 is a good time to buy a house in Florida outlines the broader opportunity and the risks.
3. Stress-test the payment
Run a budget at the quoted mortgage rate and at a rate at least 0.5 percentage point higher. Do not base a purchase on the assumption that refinancing will be available quickly. County values help narrow the search, but cash flow determines whether the home is sustainable.
4. Investigate the property, not only the county
Roof age, elevation, wind mitigation, flood zone, building reserves and special assessments can create large differences between two similarly priced homes. This is especially important for condos, where building finances can determine loan eligibility.
What the data mean for sellers
The 2026 market rewards accurate pricing. In counties with annual declines, sellers are competing against more buyer choice and a higher sensitivity to property condition. Pricing from the pandemic peak or from an exceptional nearby sale can lead to longer marketing times and repeated reductions.
In counties with positive appreciation, sellers still need to distinguish between broad county momentum and the immediate competition in their neighborhood. The strongest launch strategy is based on recent comparable sales, current listings and the likely monthly payment for the target buyer.
Statewide transaction momentum is encouraging. Florida Realtors reported 26,036 existing single-family closings in June, up 9.3% from a year earlier, and 8,900 condo-townhouse closings, up 14%. Single-family inventory stood at 4.5 months, while condo-townhouse inventory was 8.1 months. The gap confirms that property type matters as much as geography.
What investors should watch next
Investors should resist treating the strongest annual gains as a list of automatic buys. Smaller counties can offer lower acquisition costs, but rents, vacancy, property management capacity and resale depth may be less predictable. In high-value coastal counties, slower appreciation can coexist with strong demand for specific luxury, seasonal or waterfront properties.
The most useful county screen combines four variables: entry price, annual value direction, five-year value retention and total carrying cost. Add local rent data and employment growth before estimating a return. Also review the effects of insurance and Florida property-tax rules, particularly when comparing a homesteaded owner’s costs with those of a new buyer or investor.
Florida’s 2026 housing story is normalization with durable value
Florida home prices by county show a market moving through different stages of the same adjustment. Forty-five counties have lower typical values than a year ago, but 22 are still appreciating. The statewide index remains more than 25% above its June 2021 level, and June transaction volumes improved sharply.
The positive Florida case is not that prices can only rise. It is that the state is regaining transaction activity while local markets reset to levels buyers can support. South Florida retains deep premium demand. Central Florida and Tampa Bay offer more negotiating room. Northeast Florida combines high-end suburbs with more attainable urban prices. North Florida’s lower-cost counties are still recording some of the state’s strongest gains.
For buyers and investors, that dispersion creates choice. For sellers, it raises the value of local pricing discipline. For Florida as a whole, it points to a more selective and ultimately more sustainable housing market than the boom years produced.
Frequently asked questions
What is the average home price in Florida in 2026?
Florida’s typical home value was $378,126 in June 2026, according to the Zillow Home Value Index. Florida Realtors separately reported a June median sale price of $432,000 for existing single-family homes and $305,000 for condo-townhouses. The figures differ because they measure different groups of homes.
Which Florida county has the highest home prices?
Monroe County has Florida’s highest typical home value at $966,261. The county includes the Florida Keys. Walton County ranks second at $654,437, followed by Collier County at $555,973.
What is the cheapest county in Florida to buy a house?
Calhoun County has the lowest typical home value in Florida at $179,336. Jackson County is next at $183,231, followed by Holmes County at $189,067. A low county-level value does not account for property condition, insurance, financing or access to jobs and services.
Are Florida home prices falling in 2026?
Florida’s statewide typical home value was down 2.8% year over year in June 2026. Values declined in 45 of 67 counties, while 22 counties recorded gains. The statewide value was still 25.3% above June 2021, so the current data indicate normalization from pandemic-era highs rather than a return to pre-pandemic prices.
Where are Florida home values rising fastest?
Lafayette County recorded the strongest annual increase at 7.5%, followed by Liberty at 4.6%, Taylor at 4.5%, Dixie at 4.2% and Hamilton at 4.1%. Most of the fastest-growing counties have values below the statewide level.
Why is the typical home value different from the median sale price?
A typical home value index estimates values across the full housing stock and adjusts for changes in the mix of properties. A median sale price includes only homes sold during the period. If more high-priced homes close in one month, the median can rise even when the value of a typical home is flat or lower.
Sources and methodology
- Zillow Research Housing Data, Zillow Home Value Index definitions and source files.
- Zillow county ZHVI source file, all homes, middle tier, smoothed and seasonally adjusted.
- Zillow state ZHVI source file, used for the statewide value and five-year comparison.
- Florida Realtors June and second-quarter 2026 housing report, used for closed sales, sale prices and months of supply.
- Zillow June 2026 Market Report, used for U.S. and metro-level sales, inventory and value context.
Methodology: Miami Finance Review downloaded Zillow’s county and state ZHVI files on July 29, 2026. The analysis selected Florida counties and the June 2026 observation, calculated one-year changes from June 2025 and five-year changes from June 2021, then ranked counties by typical home value and annual change. Zillow may revise historical observations as its models and source data are updated. County figures are market estimates, not appraisals of individual properties. This article is for informational purposes and is not investment, tax, insurance or legal advice.
Market intelligence. Capital insight. Delivered daily.
Miami Finance Review produces independent editorial analysis. Figures are attributed to their sources and independently cross-checked where possible. This content is informational and is not investment, legal, tax or lending advice.